analyze ga4 bigquery data locally with duckdb
This article presents a workflow for analyzing GA4 data on your local machine. This approach offers several distinct advantages. You can run unlimited exploratory queries without spending your BigQuery quota. All analysis remains completely private on your own computer. You can seamlessly integrate SQL queries with Python scripting for advanced modeling and automation. And perhaps most importantly, this entire method is free.
The core of this process relies on DuckDB, a free and open source OLAP database management system. In this context, it functions as a lightweight and extremely fast engine for running SQL queries directly on files, such as the Parquet files we will export from BigQuery. It requires no complex server setup. You can use it directly from a command line interface or within a Python script, making it an ideal tool for local data analysis.
Table of contents
Exporting GA4 Data from BigQuery
The first step is to get your GA4 data out of BigQuery and onto your local machine. While you could use a Python client to query the database directly, this often requires a more involved setup. A simpler method is to first export the data to Google Cloud Storage (GCS) and then download the resulting files.
The recommended file format for this process is Parquet, an efficient columnar storage format that is compatible with DuckDB. The benefit is that the final Parquet file could be one-third the size of the original query.
You can use the EXPORT DATA statement in BigQuery to save a date range of your GA4 event data to a GCS bucket.
Note: Before running this script, create a bucket in your Google Cloud Storage.
CREATE TEMP TABLE temp_export_table AS
SELECT *
FROM `selnekovic-com.analytics_123456789.events_*`
WHERE _table_suffix BETWEEN '20230101' AND '20230331';

EXPORT DATA OPTIONS(
  uri='gs://temp_ga4_exports/ga4_export-*.parquet',
  format='PARQUET',
  overwrite=true
)
AS
SELECT *
FROM temp_export_table;
After running the script, navigate to your GCS bucket, and you will find one or more Parquet files with the ga4_export- prefix. Download these files to a data folder within your local project directory.
Setting Up Your Local Analysis Environment
For this guide, we will use Visual Studio Code as our primary editor. Once you have your Parquet files downloaded, you are ready to start the analysis. The following sections detail three different ways to work with DuckDB in VS Code.
Each method is for a different workflow and preference:
- The DuckDB CLI is ideal for quick, iterative SQL querying and for analysts who are most comfortable in a terminal. It offers the fastest path from writing a query to seeing the results.
- The VS Code Interactive Window is perfect for developing Python scripts. It allows for a step-by-step, notebook-style development process within a standard
.pyfile, making it great for building more complex data processing pipelines. - Jupyter Notebooks are the classic choice for exploratory data analysis, visualization, and creating shareable reports. If you need to generate plots or present your findings to others, this is an excellent option.
Analysis Method 1: The DuckDB CLI in VS Code
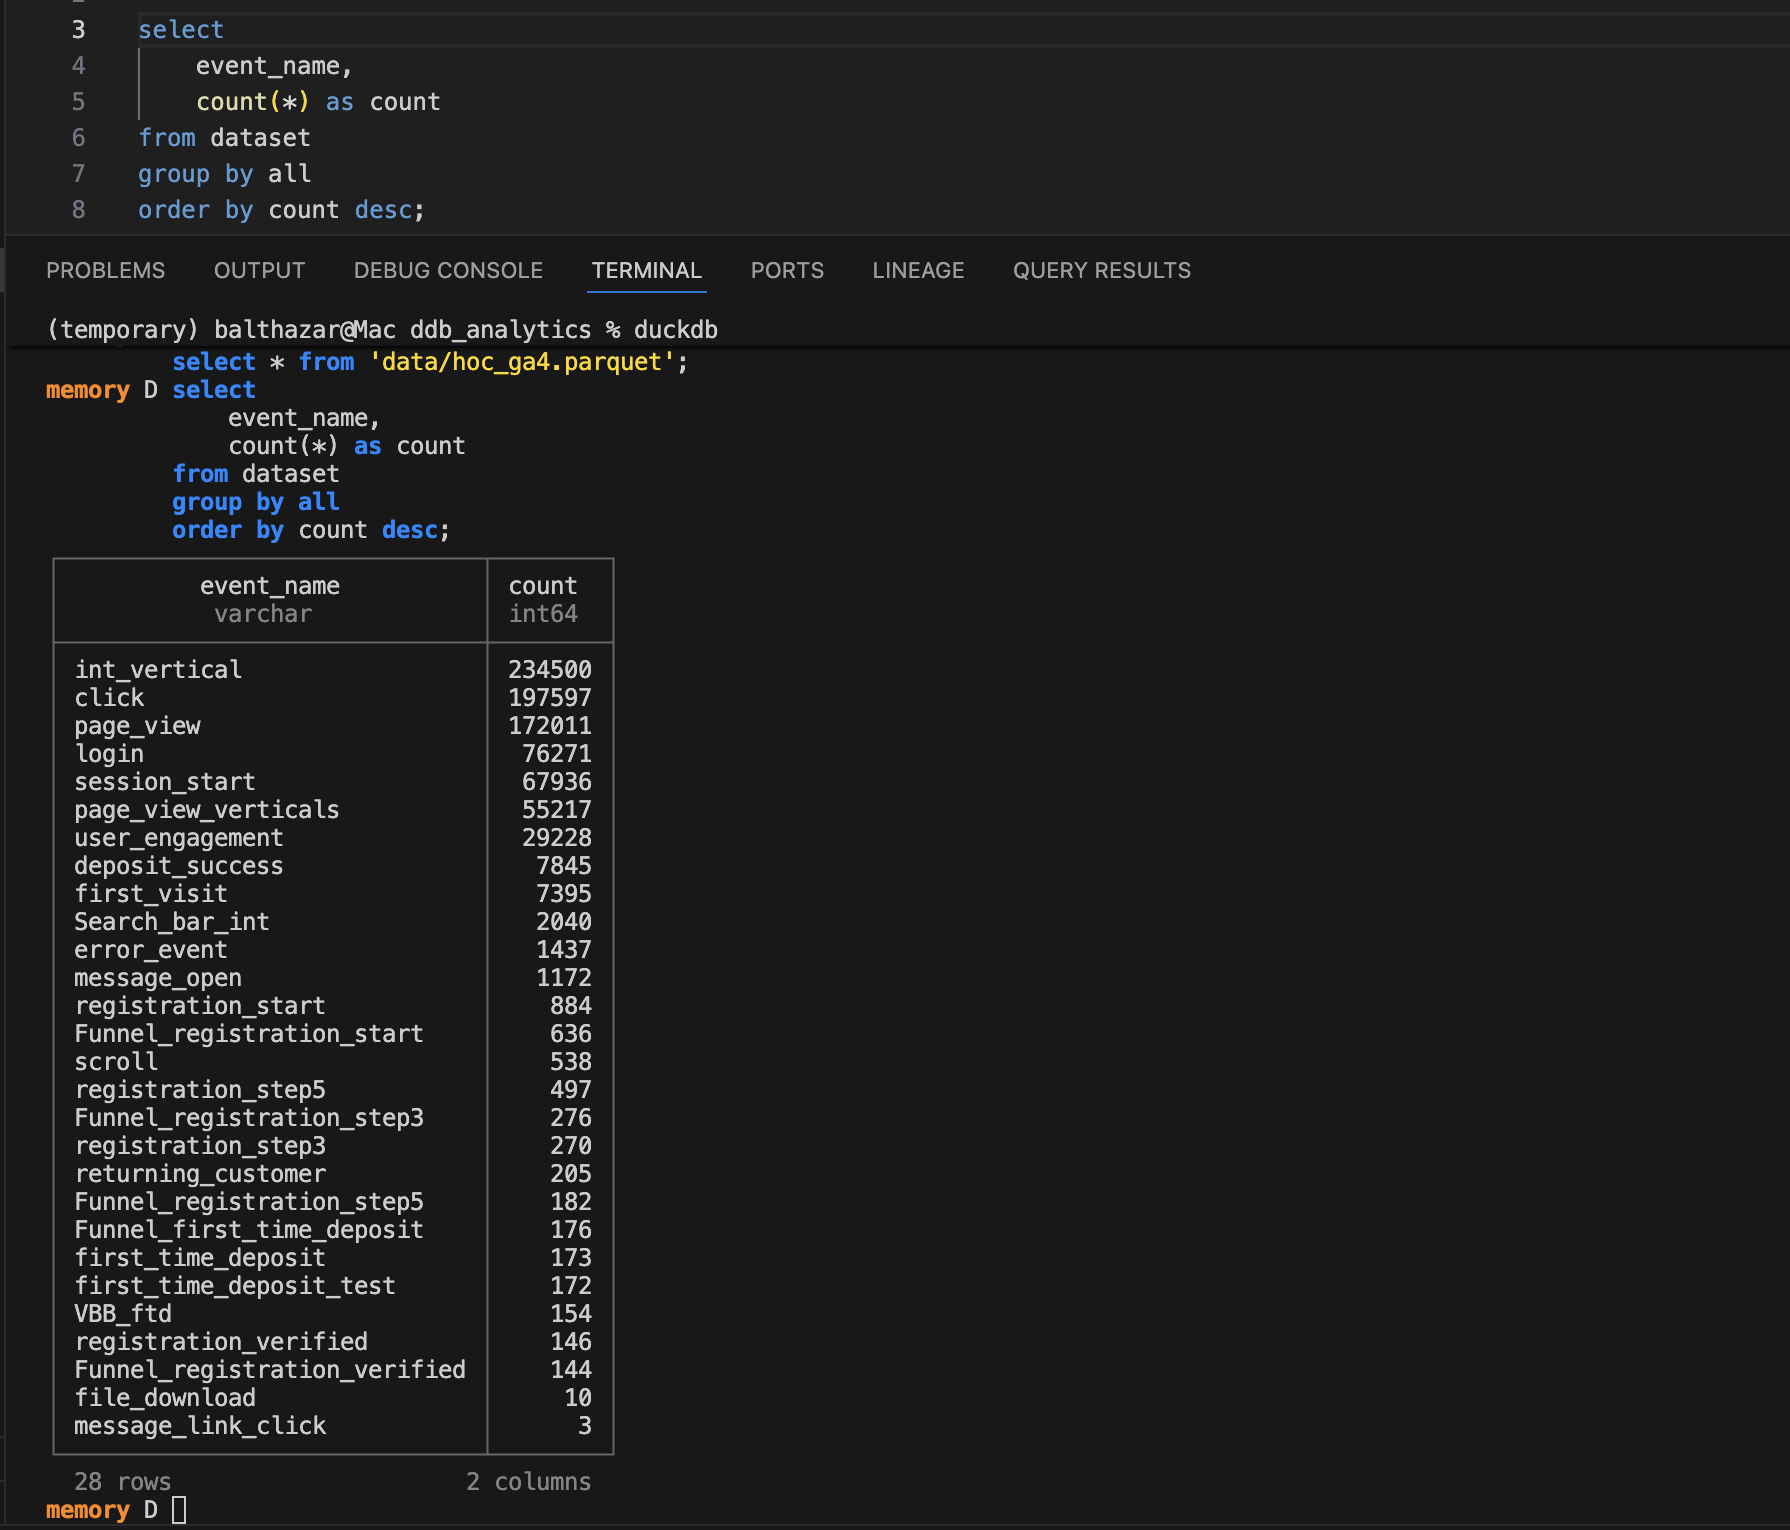
Using the DuckDB command line interface (CLI) directly within the VS Code integrated terminal is an efficient workflow. This setup allows you to write SQL in an editor panel and execute it instantly in the terminal below.
First, you need to install the DuckDB CLI. For macOS, you can use Homebrew.
brew install duckdbFor other operating systems, you can find detailed installation instructions on the official DuckDB website.
Once installed, you can create a .sql file in VS Code and set up a keyboard shortcut to send selected text from your editor directly to the terminal for execution. To do this, open your Keyboard Shortcuts (JSON) file from the Command Palette (Cmd+Shift+P or Ctrl+Shift+P and search for Preferences: Open Keyboard Shortcuts (JSON)). Add the following key binding to the file.
{
  "key": "cmd+enter",
  "command": "workbench.action.terminal.runSelectedText"
}
You can change "cmd+enter" to any shortcut you prefer. With this in place, you can open the DuckDB CLI in your terminal by typing duckdb, then write a query in your SQL file, highlight it, and press your shortcut. The query will run, and the results will appear directly in your terminal.
Analysis Method 2: The VS Code Interactive Window
If you plan to develop a Python script for your analysis, the VS Code Interactive Window offers a nice, iterative experience. This feature provides a workflow similar to Jupyter notebooks but operates within a standard .py file.
You can define code cells using a special # %% comment. This allows you to run each block of code individually, inspect the output, and build your script piece by piece. When you are finished developing, you can simply delete the # %% markers to have a clean, standard Python script ready for production.
Here is a simple example of connecting to DuckDB and querying one of your downloaded Parquet files.
# %%
import duckdb
con = duckdb.connect()
# %%
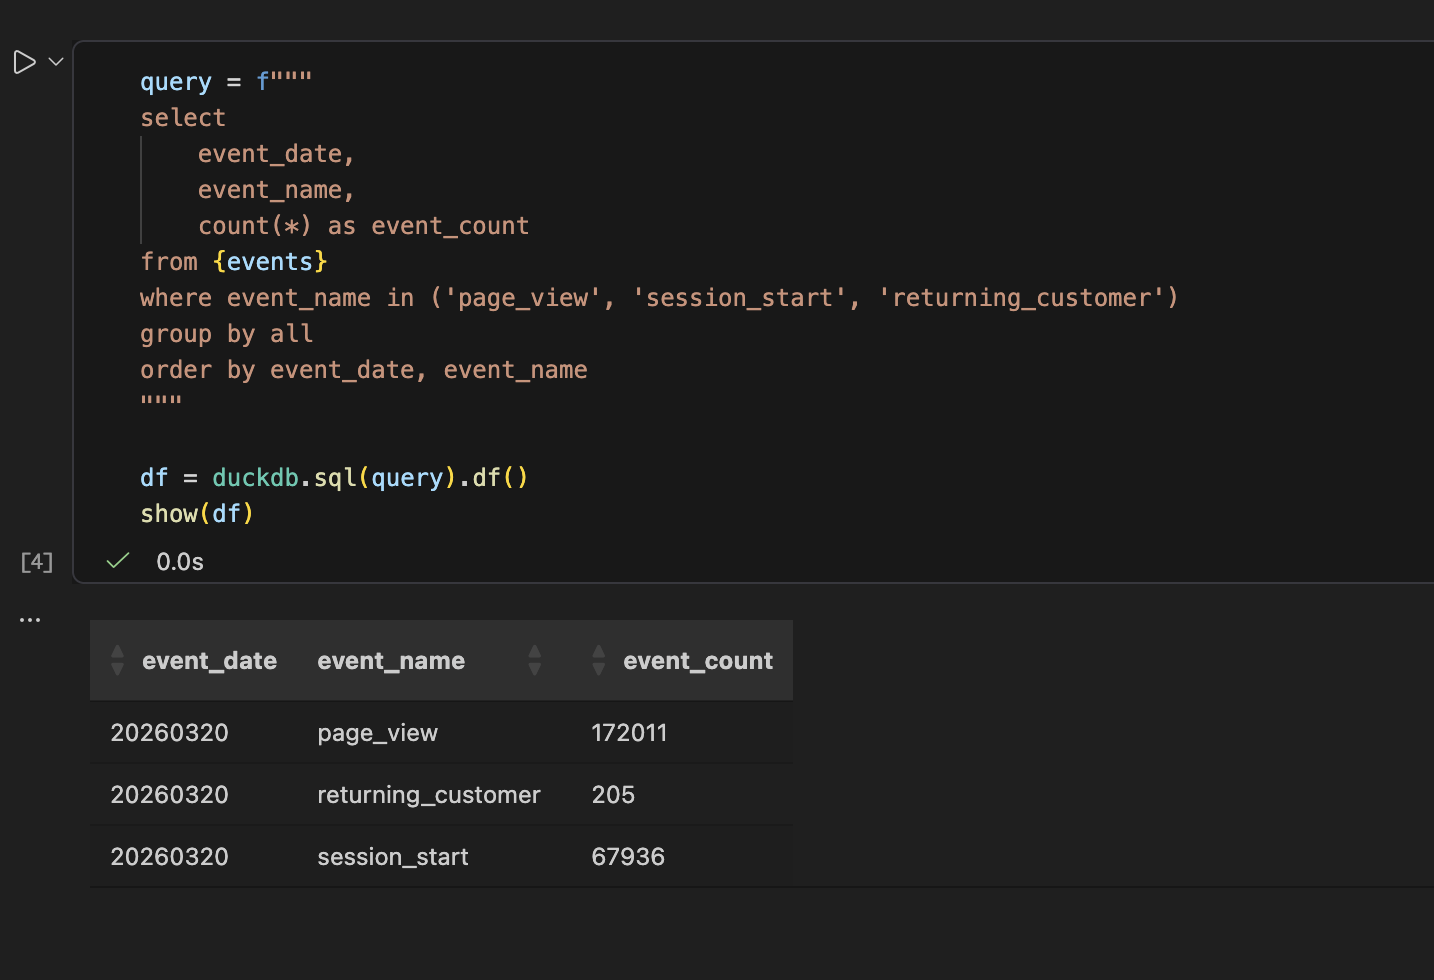
con.sql("SELECT * FROM 'ga4_export-*.parquet' LIMIT 5")Running the second cell in the interactive window will execute the SQL query against all matching Parquet files in the directory and display the resulting data frame. This is extremely handy for testing queries and data transformations before finalizing your script.
Analysis Method 3: The Classic Jupyter Notebook
Of course, you can always use a classic Jupyter Notebook for your analysis. This approach remains a great option for more exploratory work, especially when you need to generate plots or charts to visualize the data. It is also well suited for creating reports or presentations that combine code, text, and visualizations in one coherent document.
You can run the same Python and DuckDB code from the previous example within the cells of a Jupyter Notebook. The environment is perfect for iterating on data visualizations with libraries like Matplotlib or Seaborn and for documenting your thought process alongside the code itself. This makes Jupyter an ideal choice when the final output is not just a dataset, but an analytical story.
Bonus
To help you, I’ve prepared a ready-to-use project template. It uses uv, a fast Python package and environment manager that simplifies dependency handling.
To get started:
- Download — navigate to the GitHub repository and click the green <> Code button.
- Extract — select Download ZIP and move the contents to your local project directory.
- Launch — once extracted, you will have a clean, uninitialized project structure providing all the necessary scripts and configurations in a standard folder.
Now that you have this local setup, you are ready to unlock deeper insights from your GA4 data. Happy analysing.