rfm and rfe analysis in practice
If you work in performance marketing, you will sooner or later encounter the question of customer segmentation. While a “one size fits all” approach might work for dozens of customers, for hundreds or thousands it is better to use a simple system that quickly identifies who deserves more attention, who needs to be retained, and who should be meaningfully reactivated.
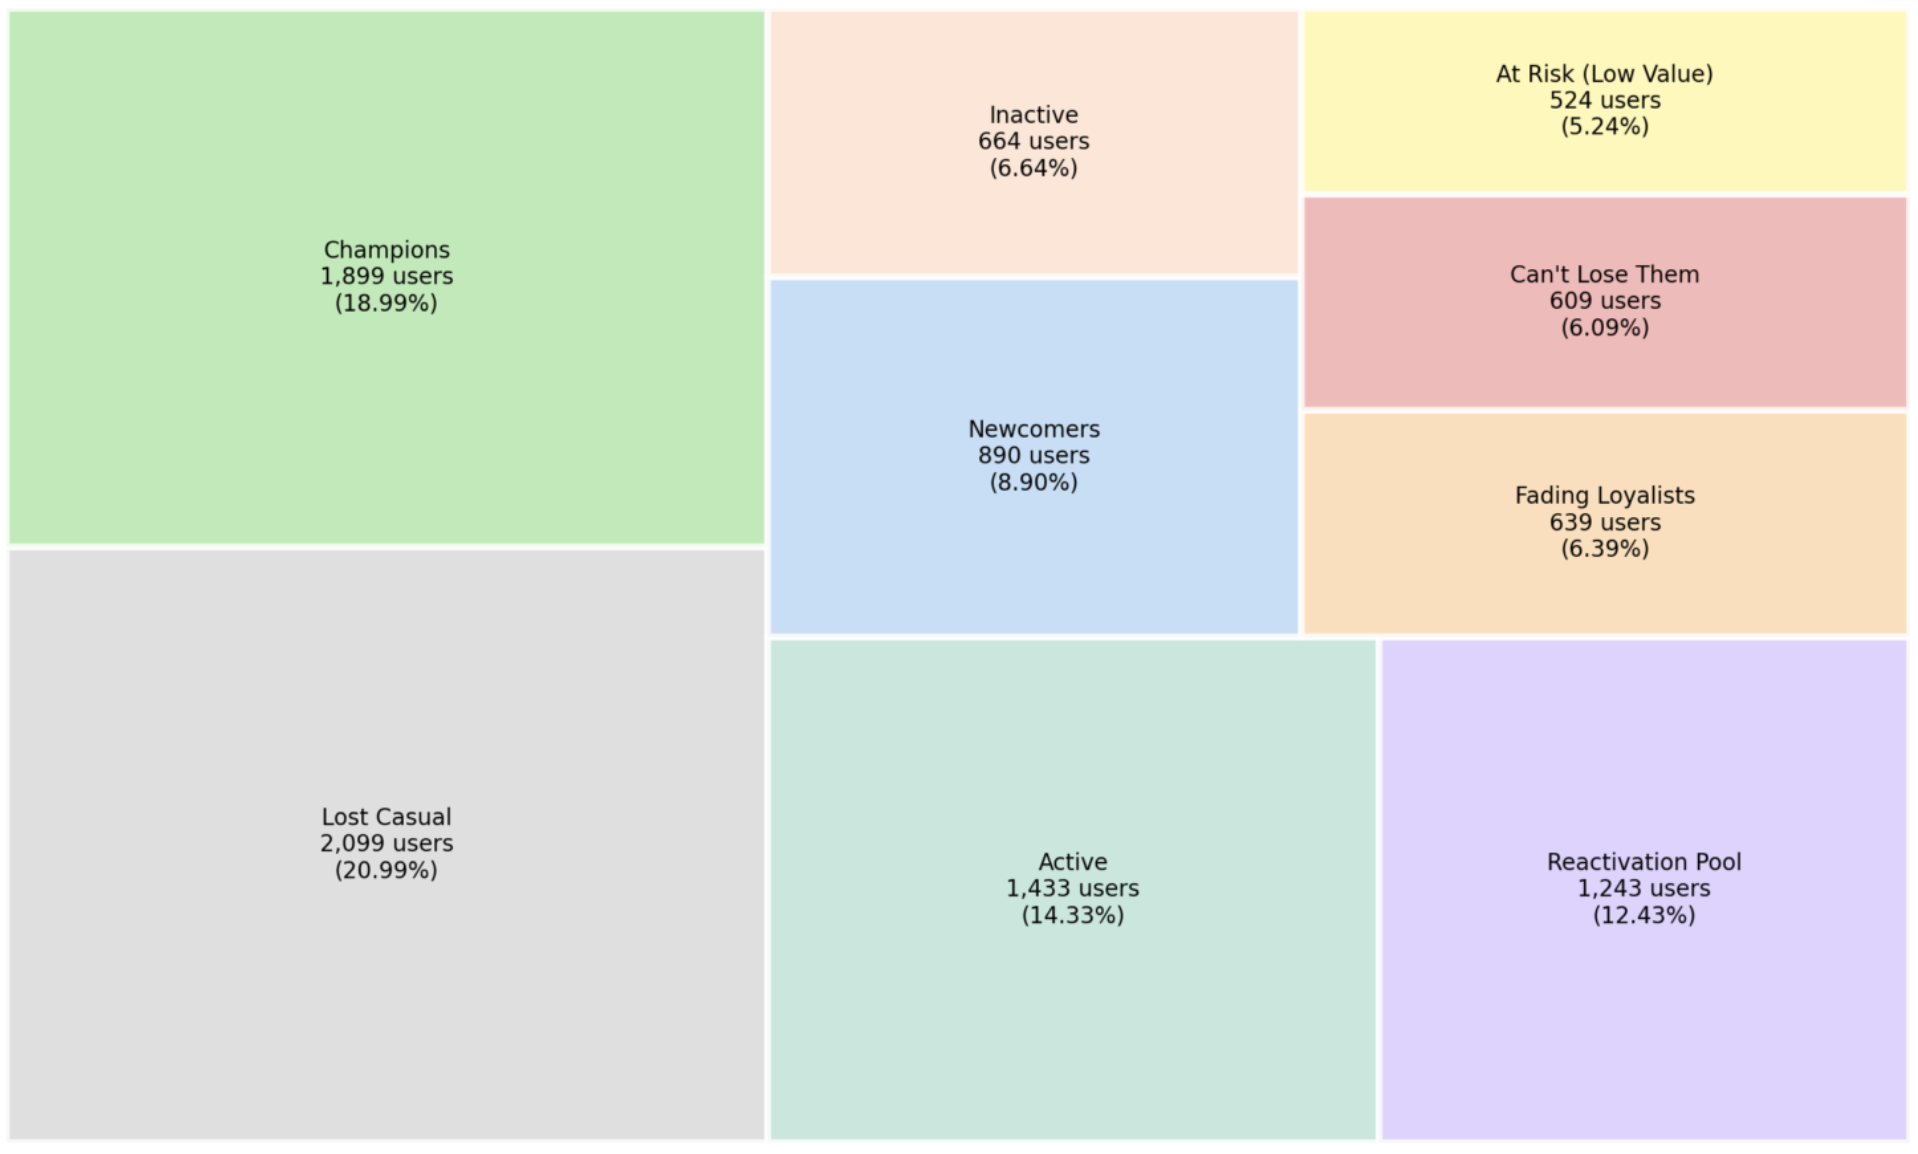
This is exactly what the RFM model (Recency, Frequency, Monetary) and its variant RFE (Recency, Frequency, Engagement) are for. They are based on historical behaviour, assign a score to each user, and allow you to turn the results into segments like Champions, Loyal, or At-risk. Crucially, these segments can be transferred to your CRM system or Google Analytics to create audiences for activation.
Note: To get hands-on, you can try RFM or RFE analysis on your own data or use a prepared demo dataset in my tool. Read further…
Table of contents
What is RFM Analysis?
RFM analysis is a technique for segmenting customers based on transaction (or other) history across three dimensions:
- Recency (R) — When did the customer last purchase?
- Frequency (F) — How often do they purchase?
- Monetary (M) — What was the total value of the orders?
In practice, this gives a consistent way to answer questions such as “Who are my best customers?”, “Who had value but is churning?”, or “Who has the potential to become loyal?”.
The advantage of RFM is that it relies on data-driven scoring rather than subjective categories. The disadvantage is that it simplifies customers based on history without context; results depend heavily on chosen boundaries and may not explain “why” or predict future actions.
No Online Sales Revenue? Use RFE
Not every business has a natural “Monetary” value to use (e.g. content websites). In such cases the RFE variant makes sense, where Monetary is replaced by Engagement (E).
Engagement can be expressed in various ways, such as:
- Time on site
- Number of pages viewed
- Goal completions
It is important that “value” represents engagement consistently for all users so that the resulting segmentation is stable and comparable.
How RFM/RFE Scoring Works
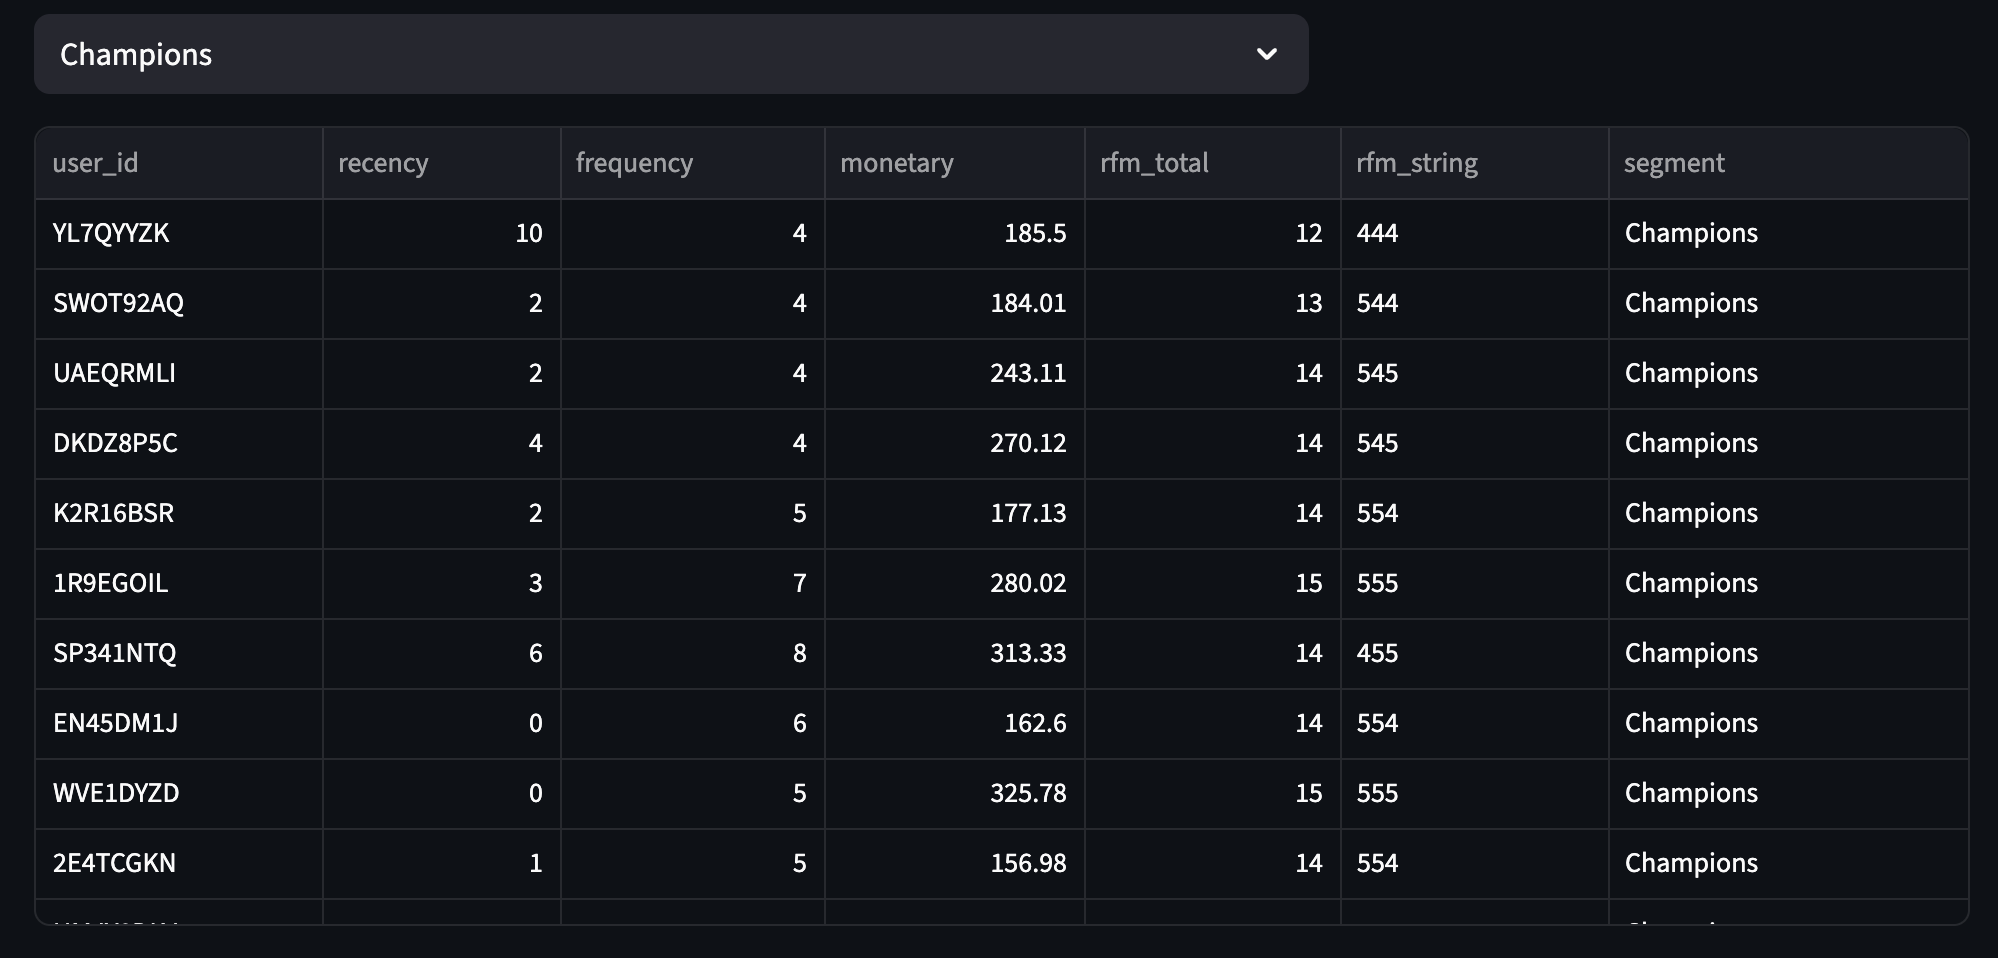
You don’t need a PhD in data science to calculate RFM; basic math is enough. For each user you calculate an R–F–M score on a scale of 1 to 5.
Typically this is done using quantiles (dividing the data by rank), where the best group gets 5 and the weakest 1. The result is three scores: R, F, and M (or E for RFE). To use this in campaigns, these values are combined into a single segmentation category.
Combining Scores into a Final Segment
The method you choose determines whether you get many fine micro-segments or fewer broad groups, and how sensitive the final rating is to a drop in one dimension. Four common approaches:
- Concatenation (joining scores): Join R, F, and M (or E) into one code. Example: R=5, F=4, M=3 → “543”.
- Addition (sum of scores): Final score = R + F + M. On a 1–5 scale the range is 3 to 15.
- Multiplication (product of scores): Score = R × F × M. Range 1 to 125.
- Weighted addition: Assign a weight to each dimension and compute a weighted sum, e.g. wR·R + wF·F + wM·M.
Segment Activation
Segments in a table don’t generate revenue. The real value of RFM analysis arises when you “feed” this data into your marketing tools:
- Personalization in CRM and emailing: Don’t send the same newsletter to everyone. Champions deserve a VIP thank you or early access to news (without needing discounts), while the At-risk group can be motivated to return with win-back coupons.
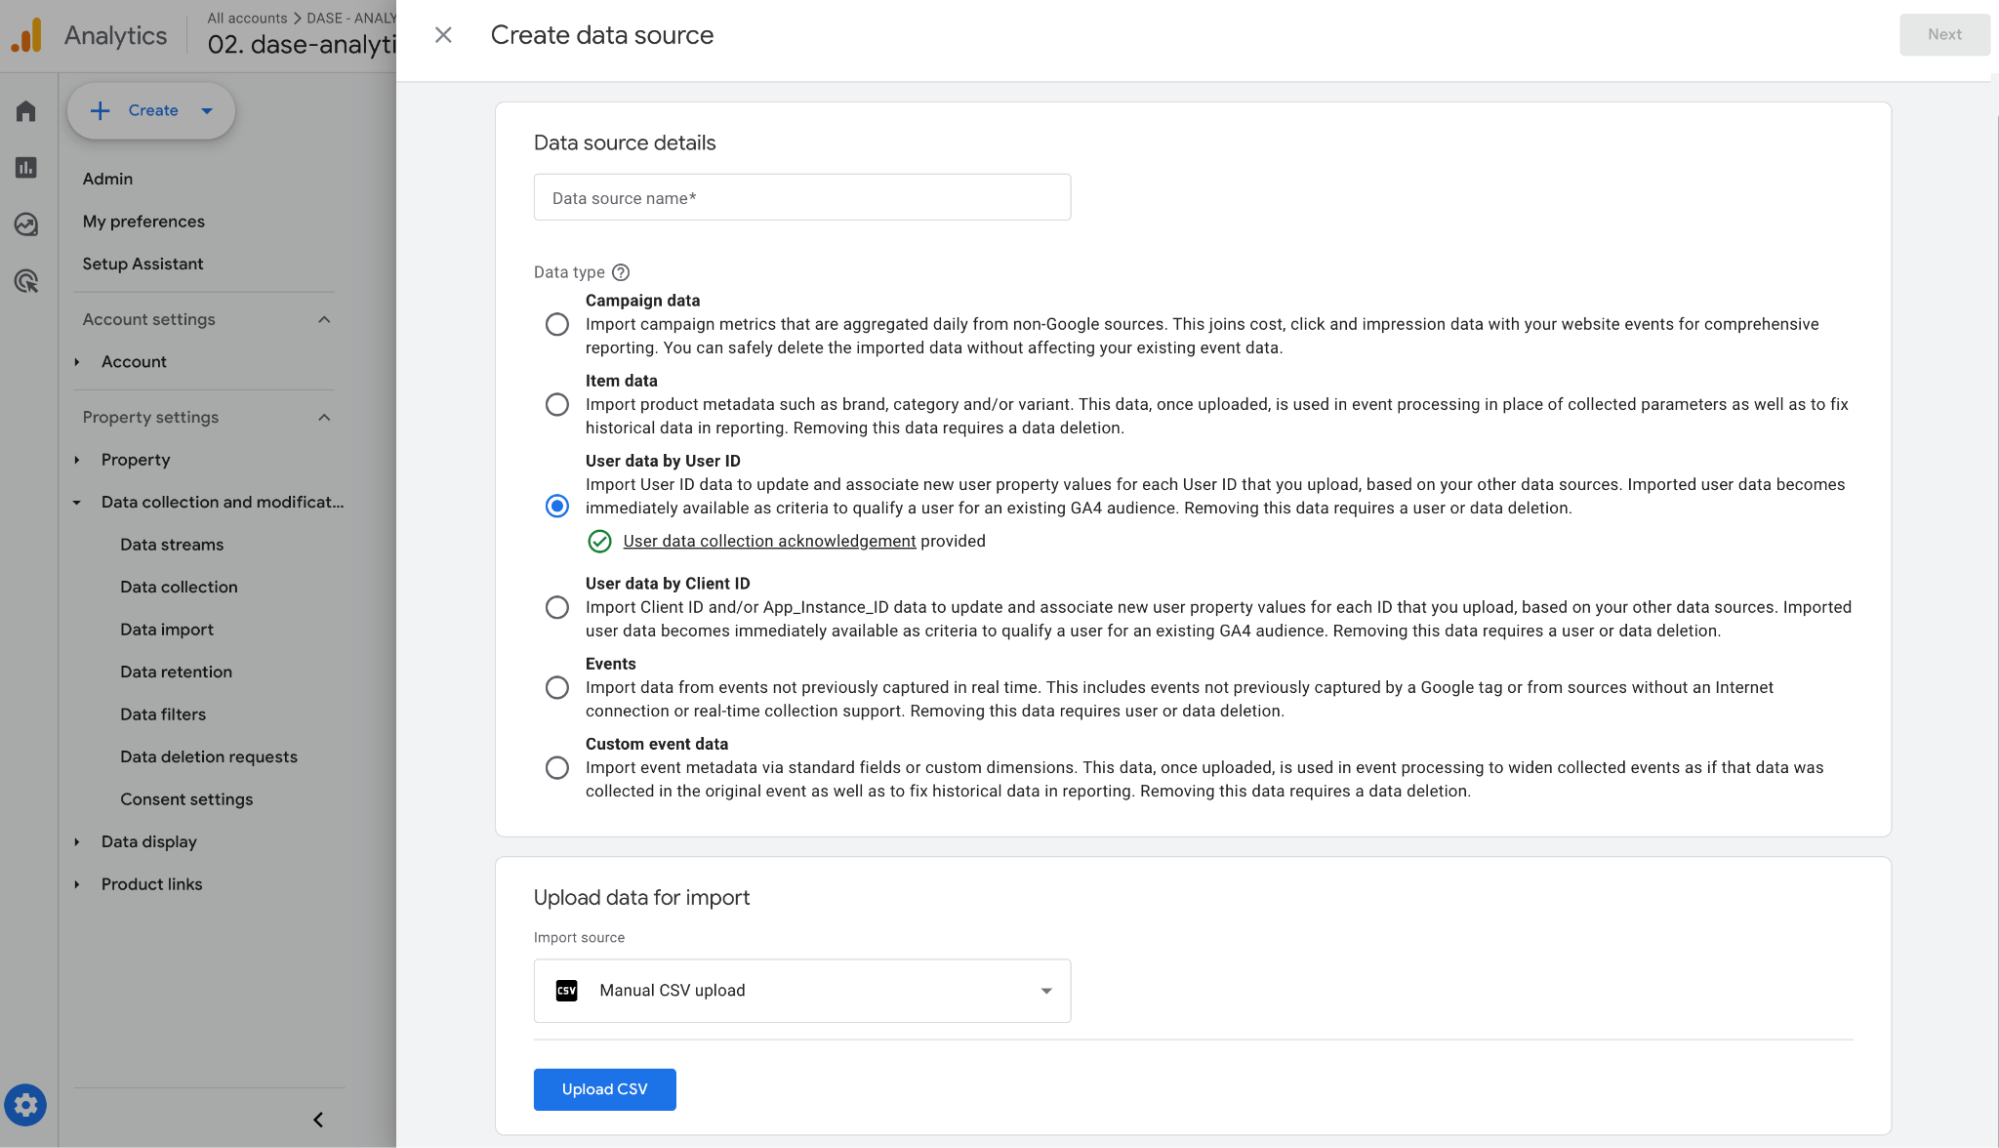
- Smart audiences in GA4 and Google Ads: Import segments into GA4 as User Properties. This allows you to create relevant audiences for remarketing, targeting users based on actual value and behaviour rather than just demographics.
RFM/RFE Calculation “On Demand”
If you want to try RFM/RFE analysis, you can use our web application. It is free and only requires a CSV file with a user ID, activity date, and value.
Link to the app: https://rfm-rfe-customer-analysis.streamlit.app/
Detailed explanations of individual segments can be found directly in the app under Segments explanation, showing typical behaviour and suitable activation types (retention, reactivation, or upsell).
Conclusion
RFM and RFE are simple but effective ways to segment users from historical behaviour and turn that into activation. By using three dimensions and scores, you get segments that are easy to interpret and use in campaigns. The more consistent and clean your data (dates, IDs, values), the better the results.