Do you live in the wild jungle of digital marketing, where data from Google Analytics 4 (GA4) is your good friend and data-driven decisions are the key to success?
To fully harness the potential of GA4, you need a tool for managing, transforming, and analyzing marketing data that enables this. The solution is simple — Google BigQuery, your versatile tool for advanced data analytics (and much more). If you’re not yet familiar with Google BigQuery, it’s a data warehouse that allows efficient handling of large volumes of data within the Google Cloud platform.
In this post, I’ll explore the possibilities of using BigQuery for digital analytics — from raw GA4 data, through their transformations, to enriching data from various sources or sending your data via server-side Google Tag Manager (sGTM).
Raw Data from GA4
Not all web data collected using Google Tag Manager is available in GA4. The reason is the consent mode. When users do not consent to tracking, Google limits the use and storage of their data, leading to incomplete data in GA4 reports.
One advantage of integrating BigQuery with GA4 is access to raw, unsampled data. The GA4 export to BigQuery includes a broader range of data, including those generated without user consent, known as anonymized cookieless pings.
Interested in numbers? We conducted a simple comparison of page views for three of our clients. In GA4, we used the “Explorations” report, and in BigQuery the GA4 data export. Illustratively, I selected clients from three different areas, with varying data volumes.
| GA4 | BigQuery | difference in % | |
|---|---|---|---|
| blog | 5 383 | 8 864 | 39.27 |
| services | 296 421 | 540 364 | 45.14 |
| e-commerce | 1 611 035 | 2 330 819 | 30.89 |
As you can see, there was on average 38% more data in BigQuery than in GA4. This figure is individual for each site, but we commonly encounter values ranging from 30% to 50%. It depends on the specific website, segment, and cookie banner settings.
A significant difference, wouldn’t you say?
Another benefit of integration is access to all dimensions you send to GA4, not just those you’ve registered.
In GA4, there can be an issue with cardinality. This means that a large number of unique values for certain dimensions, such as various unique identifiers (e.g., user ID), can cause inaccuracies in reports. When cardinality is high, GA4 may aggregate data to fit into reports, resulting in less detail and accuracy.
Transforming Data from GA4 Export
If you’re using raw data from the GA4 export for reporting in Looker Studio, you’ve likely encountered two inconveniences — slow loading and odd results when blending data. These can sometimes be quite troublesome.
It’s advisable to “tidy up” the raw data from the GA4 export before use to prepare them for analysis and reporting. Even if you’re not a data specialist or SQL expert, with the help of the internet or AI, you can relatively easily create basic reporting tables, whether you want them at the event scope, session, user, item, or otherwise.
The result may be, for example, a custom reporting table like this:

You set up automatic updates, connect with Looker Studio, and you’re done. Well, perhaps I’m exaggerating a bit. It’s not that simple. If you need assistance, feel free to contact me 🙂
Sometimes, these transformations accumulate and become complex to manage. This is where Google Dataform comes into play. It’s a tool that helps manage and execute data transformations stored in BigQuery. However, working with it requires knowledge of SQL and JavaScript, which can be challenging for many.
Enriching Data
To gain a truly comprehensive view of marketing performance, relying solely on GA4 data isn’t sufficient. It’s necessary to combine them with data from Google Ads, Meta Ads, Google Search Console, and other sources. In BigQuery, this isn’t a problem. There are numerous data connectors through which you can link marketing platforms or your CRM system with BigQuery. Some are paid, but the basic ones are free.
Integrating various data sources then allows for cross-channel analysis, which is invaluable in understanding how these marketing channels work together. For example, combining data from GA4 and Google Ads can show how paid campaigns have influenced traffic and conversions on your site over the past seven days.
You can try using this nice query:
SELECT
  ga.event_date,
  ga.user_pseudo_id,
  (SELECT value.int_value FROM UNNEST(ga.event_params) WHERE key = 'ga_session_id') AS ga_session_id,
  ga.ecommerce.transaction_id,
  ga.collected_traffic_source.gclid,
  ga.collected_traffic_source.manual_campaign_id,
  ga.collected_traffic_source.manual_campaign_name,
  ga.collected_traffic_source.manual_source,
  ga.collected_traffic_source.manual_medium,
  MAX(ads.ad_group_id) AS ad_group_id,
  MAX(ads.campaign_id) AS campaign_id,
  MAX(ads.segments_click_type) AS segments_click_type,
  MAX(ads.segments_slot) AS segments_slot,
  MAX(cmp.campaign_name) AS campaign_name
FROM `project.dataset.table_*` AS ga
JOIN
 `project.gads_data.p_ads_ClickStats_00000000` AS ads
ON
 ga.collected_traffic_source.gclid = ads.click_view_gclid
 AND _PARTITIONTIME BETWEEN DATE_SUB(CURRENT_TIMESTAMP(), INTERVAL 8 DAY) AND DATE_SUB(CURRENT_TIMESTAMP(), INTERVAL 1 DAY)
JOIN
 `project.gads_data.p_ads_Campaign_00000000` AS cmp
ON
 ads.campaign_id = cmp.campaign_id
WHERE _TABLE_SUFFIX BETWEEN FORMAT_DATE('%Y%m%d', DATE_SUB(CURRENT_DATE(), INTERVAL 8 DAY)) AND FORMAT_DATE('%Y%m%d', DATE_SUB(CURRENT_DATE(), INTERVAL 1 DAY))
AND ga.event_name = 'purchase'
GROUP BY ALL;
Custom Data Sources
Enriching data also involves creating custom data sources. In addition to connecting systems using data connectors, you can stream data into BigQuery from your backend or server-side GTM. The main reason for this is that such data is either not otherwise available or you want to maximize its quantity and quality.
Since sending data from the backend is common, I will present two less traditional ways to stream data into BigQuery via server-side GTM.
- Data Quantity
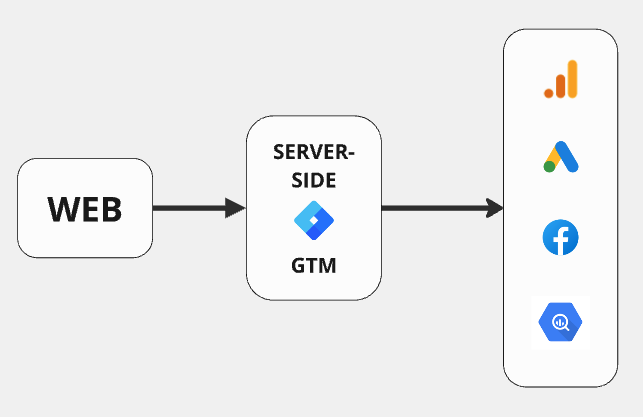
If you want to maximize the measurement of a specific event, you can bypass client-side GTM and embed the tracking code directly into your website’s script. This avoids cases where GTM doesn’t load or is blocked. Here’s roughly how it works:
The event is sent from the website to the server-side GTM, which processes it and sends it to BigQuery. The obtained data can also be forwarded from server-side GTM to marketing platforms like Google Ads or Meta Ads. I emphasize that in every case, you must consider what data you are collecting and whether you have consent for its use! - Data Quality
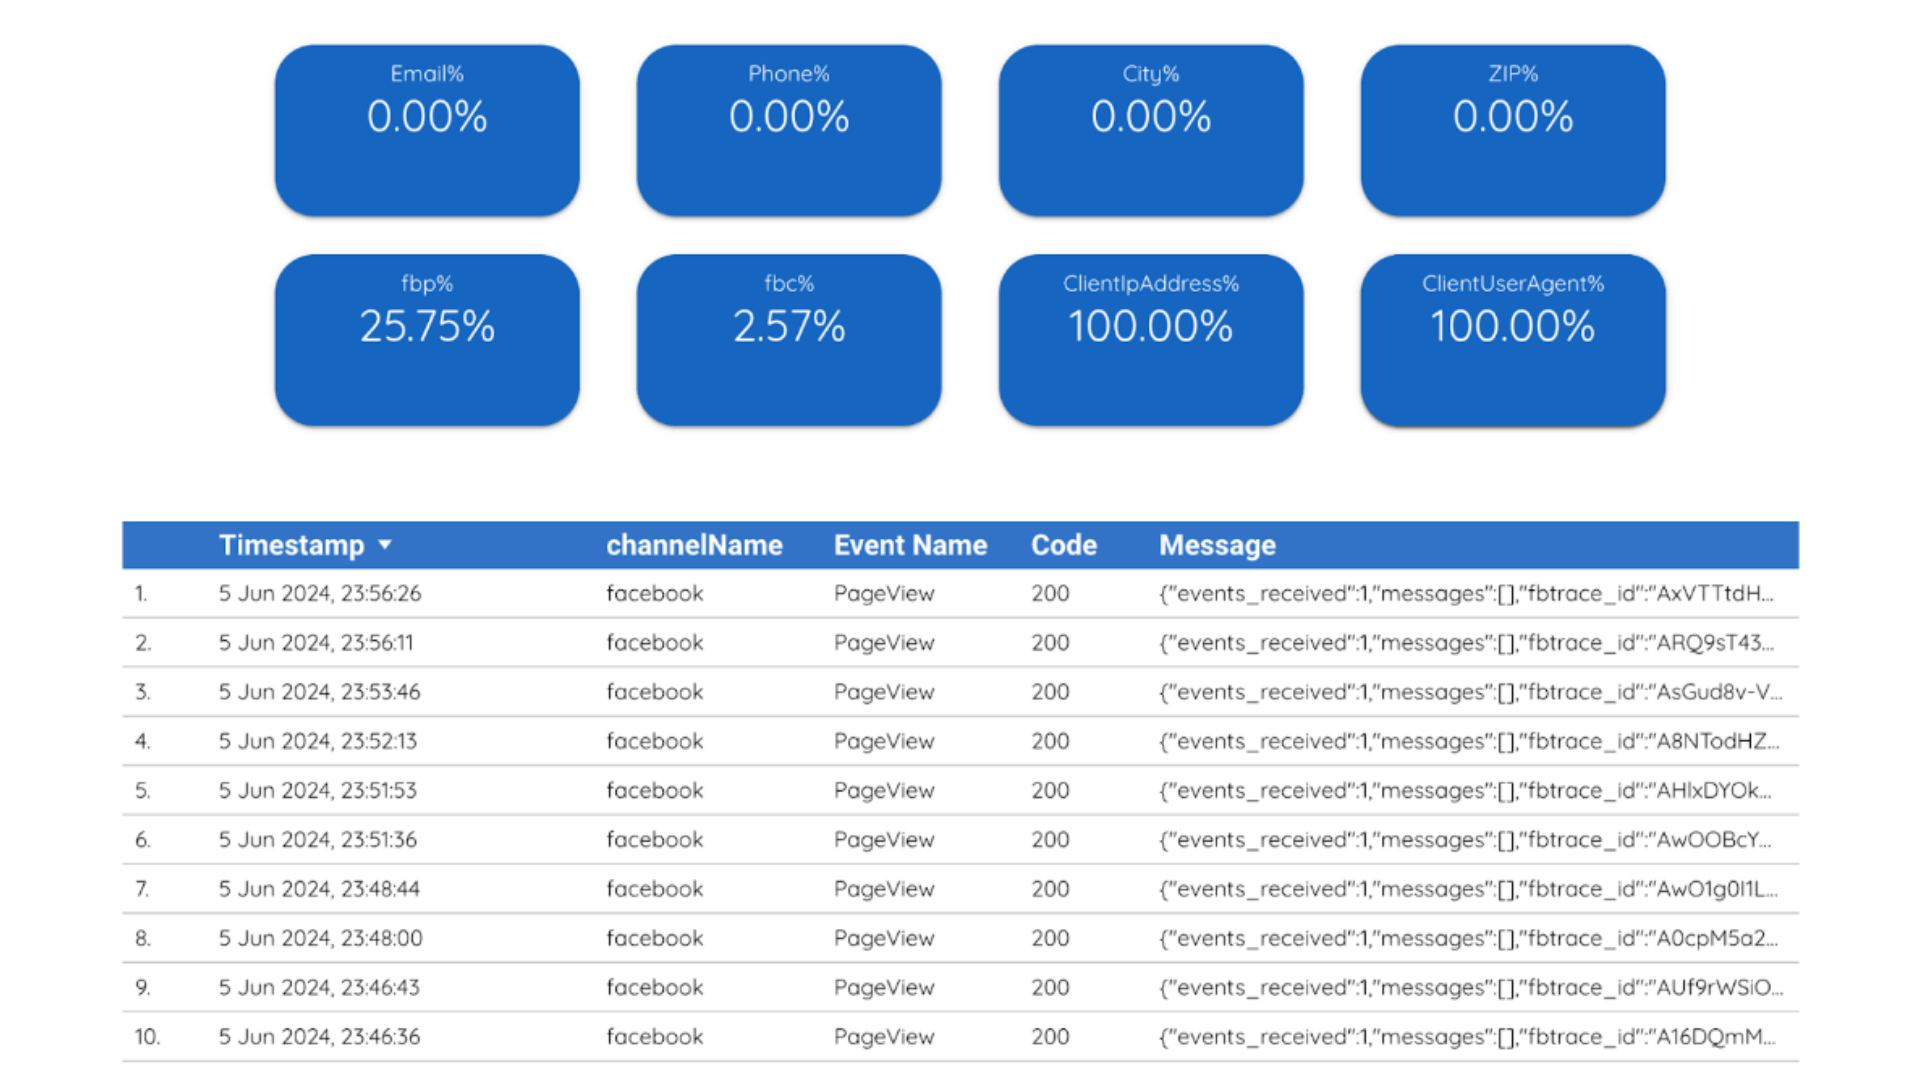
A great example is checking the data sent via the Facebook Conversion API. You might think, “But I can see event match quality on Facebook.” Yes, but not detailed information or data that was not processed due to incorrect formatting or errors.
At Dase, we use a modified FB Conversion API tag that stores all data sent to Facebook in BigQuery, along with information on whether it was processed or not. After connecting this to Looker Studio, the result is a Data Quality Report that helps identify opportunities to improve data quality and quickly reveals potential issues.
Conclusion
And that’s not nearly everything you can do with BigQuery. If you want to try your hand at data science and are friends with Python, BigQuery has direct integration with Jupyter Notebook.
This opens up possibilities for exploratory analysis, advanced analytics, or machine learning applications. For the latter, you don’t even have to use Jupyter Notebook. Some machine learning models are available directly in BigQuery via SQL — but that’s another story.
As they say, nothing is free. Neither is BigQuery. At the very least, it will cost you the time and effort you invest. But in return, you’ll gain more data to make better-informed decisions.
Note: this post was originally written for Dase.